


FOMC Minutes Today: 3 USD and Gold Scenarios Traders Should Prepare For
The Fed releases the July FOMC minutes on 19 August 2026. Here are three USD and gold scenarios, confirmation signals, and a practical risk checklist for traders.
Original

简体中文
繁體中文
English
Pусский
日本語
ภาษาไทย
Tiếng Việt
Bahasa Indonesia
Español
हिन्दी
Filippiiniläinen
Français
Deutsch
Português
Türkçe
한국어
العربية
اردو




Abstract:U.S. nonfarm payrolls for May slightly exceeded expectations, stabilizing investor sentiment and easing fears of a hard landing. This upbeat data sent U.S. equities broadly higher, led by tech stocks, with the Dow and S&P 500 posting significant gains. However, behind the optimism lies a fresh round of market debate over the Federal Reserve’s rate path, with uncertainty around inflation and interest rates remaining a key risk ahead.

The May nonfarm payrolls report showed the U.S. job market remains resilient, with job gains coming in slightly above market forecasts. Although previous months saw downward revisions, the overall trend still signals a stable labor market. Private sector hiring continued steadily, unemployment held near historic lows, and average hourly earnings rose moderately.
Markets interpreted this data as a “goldilocks” signal—neither too hot nor too cold—supporting hopes for a soft landing. After the release, investor confidence returned quickly, with multiple asset classes rallying in sync. U.S. dollar, Treasury yields, and equities all moved significantly, reflecting an active re-evaluation of macroeconomic prospects.
1. U.S. Stocks Surge, Tech Rebounds
Following the jobs report, all three major U.S. indices closed higher. The S&P 500 surpassed the 6000-point mark for the first time in three months, the Nasdaq jumped over 230 points, and the Dow surged more than 440 points, ending a two-week losing streak. Meta led the tech sector with an impressive 8% daily gain, while Amazon and Nvidia also rallied.
Despite a weekly decline, Tesla rebounded more than 3% on nonfarm day, suggesting investors are rotating back into high-growth names on renewed economic optimism.
2. U.S. Dollar and Treasury Yields Rise
The U.S. Dollar Index rose by approximately 0.46%, returning above the 99 level, reflecting renewed confidence in the U.S. economy. The 10-year Treasury yield climbed above 4.5%, while the 2-year yield breached the 4% mark—indicating the markets diminishing hopes for near-term Fed rate cuts.
3. Mixed Commodity Performance
Energy markets rallied on expectations of economic strength. WTI crude rose more than 6% for the week—its biggest gain in six weeks—while Brent followed suit. Natural gas surged nearly 10% in the same period. However, precious metals were mixed: gold fell around 1% under pressure from rising yields, while silver remained firm, indicating investor hedging behavior.
Despite the near-term boost, the report also reintroduces uncertainty, particularly around the Feds monetary policy timeline. While markets had priced in rate cuts later this year, the robust employment data could justify a longer pause from the central bank.
Fed officials have repeatedly emphasized the need for further evidence of inflation moderation and labor market cooling before easing. The current report suggests a steady economy, which may push back the expected pivot.
Meanwhile, rising commodity prices—especially in energy—could reignite inflation concerns. Higher oil and gas prices may feed into consumer costs, potentially stalling progress on disinflation and reducing policy flexibility.
Investors now find themselves navigating a tug-of-war between solid data and dovish hopes. In the short term, nonfarm data offers support, but three structural challenges persist in the medium to long term:
1. Uncertain Interest Rate Trajectory
Rising bond yields reflect a market reassessment of the Feds easing path. This has direct implications for stock valuation models, particularly for growth-oriented sectors.
2. Inflation Pressure from Rebounding Raw Materials
The rebound in energy and metal prices may once again fuel inflation. If upcoming CPI or PCE figures do not show consistent decline, investor confidence could take another hit.
3. High-Frequency Data Could Disrupt Sentiment
Upcoming economic releases—including CPI, retail sales, and ISM data—may diverge from the nonfarm signal. Such discrepancies can cause sudden market volatility, increasing trading risks.
Against this backdrop, investors are advised to maintain flexibility in portfolio allocation and prioritize risk management strategies to avoid significant drawdowns from incorrect macro bets.
The U.S. nonfarm payrolls (NFP) report, published monthly by the Bureau of Labor Statistics, measures changes in employment across all sectors except agriculture. It covers about 80% of the U.S. workforce, including manufacturing, retail, healthcare, and construction.
Its significance stems from three core factors:
A Key Economic Indicator: Job creation trends often align with corporate confidence and economic activity. Growth typically signals expansion; contraction can hint at recession.
A Fed Policy Input: The Federal Reserve closely watches NFP numbers when determining rate policy. Its a primary input for judging economic momentum.
A Market-Moving Metric: The release routinely triggers immediate price swings in the dollar, gold, bonds, and stocks. Its one of the most closely watched macro data points globally.
For investors, NFP is not a standalone signal but rather one puzzle piece in the broader economic mosaic. Interpretation shifts depending on the prevailing macro environment.
This months nonfarm report clearly boosted market confidence, with equities and commodities responding positively. Yet, the future path depends heavily on how inflation, growth, and rates evolve together. For investors, the best approach might be cautious optimism—participating in rallies while staying prepared for potential policy or data-driven corrections.

Disclaimer:
The views in this article only represent the author's personal views, and do not constitute investment advice on this platform. This platform does not guarantee the accuracy, completeness and timeliness of the information in the article, and will not be liable for any loss caused by the use of or reliance on the information in the article.
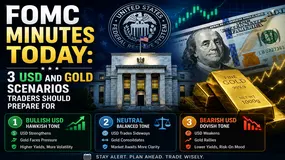
The Fed releases the July FOMC minutes on 19 August 2026. Here are three USD and gold scenarios, confirmation signals, and a practical risk checklist for traders.

A Prime of Prime forex arrangement can help a broker access trading relationships, credit intermediation, technology connectivity, and liquidity aggregation that may otherwise be difficult to obtain directly. But the label does not prove direct bank access, executable depth, or a particular execution outcome. This 2026 guide explains what a forex Prime of Prime, PoP liquidity provider, prime brokerage forex service, and forex prime broker proposal can mean in practice; where the credit and order-routing chain must be documented; how to test pricing, limits, rejects, records, and resilience; and which commercial terms create hidden operating cost. Use the comparison framework, red-flag list, and 90-day launch plan to assess fit for your client mix and risk model. The objective is a controllable execution dependency with traceable evidence, not a marketing claim about institutional access.

FINEX review 2026 for readers comparing an Indonesia forex broker: understand what Bappebti's A+++ rating does and does not show, then check floating spreads, withdrawals, segregated accounts and the complaint route for PT Finex Bisnis Solusi Futures.

Choosing a forex liquidity provider is not a search for the lowest displayed spread or the longest provider list. It is a broker decision about pricing integrity, depth, routing, credit, reporting, incident response, and client communication. This 2026 guide explains how a forex LP, FX liquidity provider, or liquidity provider forex arrangement fits into a broker’s execution chain; what to test before onboarding; why a “best forex liquidity provider” claim cannot replace due diligence; and how to compare cost beyond commission. Use the execution-quality scorecard, provider questions, routing scenarios, and 90-day onboarding plan to assess whether a liquidity relationship can support your actual client mix, instruments, risk model, and jurisdiction. The goal is not to make a universal ranking. It is to build evidence that your broker can explain, supervise, reconcile, and recover its execution service when market conditions are difficult.
WikiFXWikiFXWikiFXWikiFXWikiFXWikiFXWikiFXWikiFXWikiFXWikiFX